- Measures the peak undrained shear strength in very soft to stiff clay
- Measures the residual shear strength in clay
- Can compute the sensitivity of clay
Vane Shear Test (VST), ASTM D2573: The vane shear test accurately determines the undrained shear strength of purely cohesive soils by rotating a small vane having four blades (Figure 1) around its vertical axis to fail a cylinder of soil in torsional shear. Vanes typically have a length to diameter ratio of 2, varying from 75 mm diameter and 150 mm length to 40 mm diameter and 80 mm length to allow testing a range of soil strength using the same torque head (Figure 2). Ideally, the engineer chooses the largest size vane that will fail the soil. Note that sand, silt, or fibrous (roots or peat) inclusions disrupt the cylindrical failure surface around the vane, leading to erroneous results. Strong cohesive soil may not fail as a cylindrical surface and thus invalidate strength computations as discussed in ASTM D2573. We thank Dr. Paul Bullock for his contributions.
Figure 1: Various size VST shear heads (left) and manual penetration rig with torque head (right)
The older style of vane equipment turns the vane from the ground surface. Thus, soil usually adheres to the rods above the vane and creates a parasitic torsional resistance. This equipment usually has a “slip” coupling connection to the vane. When the engineer turns the rods, initially just the rods turn and then the rods and vane turn. He/she subtracts the rod’s torque from the total vane and rod torque to compute the vane torque.
Newer vane equipment has its torque motor, torque cell, and vane lowered in a borehole and pushed to the desired test depth or simply pushed to the desired test depth from the ground surface. A data acquisition computer precisely turns the vane at a preprogramed rotation rate and measures the torque resistance and rotational angle displaying the results on its screen. The torque power of the motor does not turn the smallest vane more than the maximum shear strength that ASTM recommends keeping a cylindrical failure surface.
Figure 2: 40 mm diameter/80 mm long; 50 mm diameter/100 mm long; 75 mm diameter/150 mm long size vanes
The engineer preferably chooses a rotation rate of 0.1 degrees per second for the first 90 degrees to measure the peak torque resistance, 6 degrees per second for ten revolutions to remold the clay, and 0.1 degrees per second for another 90 degrees to measure the residual torque resistance. Figure 3 shows a vane that has failed the clay with the clay adhering to the sides of the vane. Figure 4 shows the vane motor, torque cell and vane assembly.
Figure 3: Small vane with stiff clay adhering to it after removal
Figure 4: Vane motor, torque cell, and vane assembly
When the engineer rotates the vane more rapidly than the standard 0.1 degrees/second or 6 degrees/minute, Biscontin and Pestana (2001) show the peak undrained shear strength increases (Figure 5).
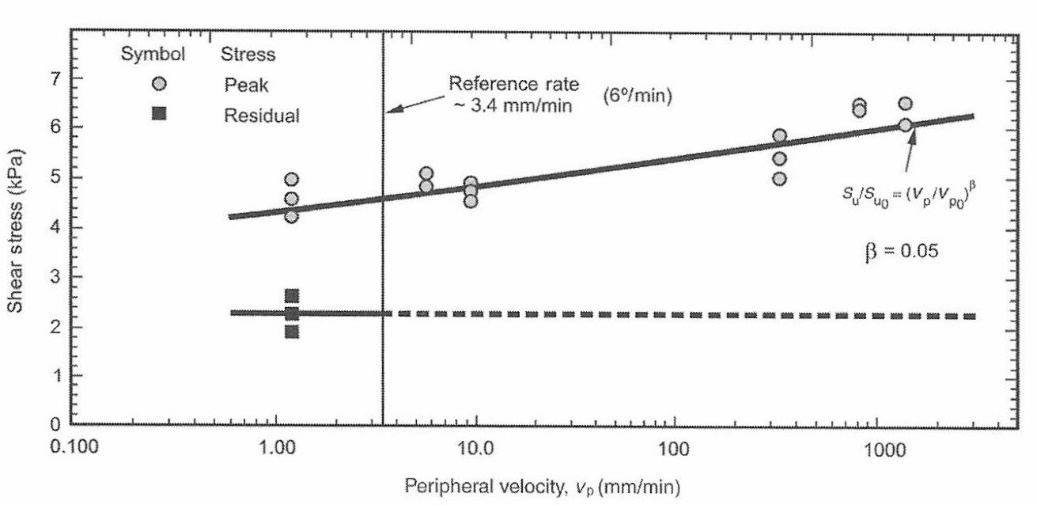
Figure 5: Rotation rate effects
The undrained shear strength computes from the torque resistance along the horizontal ends and the vertical sides. Schnaid (2009) shows the contribution of horizontal and vertical torque from the below equations:
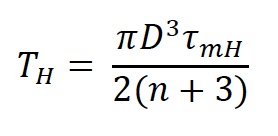
Where TH = torque on both the top and bottom shear surfaces,
D = diameter of the vane,
τmH = maximum value of shear in the horizontal plane
𝑛 = 0 for a uniform distribution of shear stress
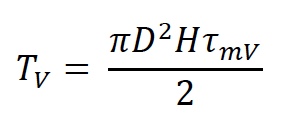
Where TV = torque along the circumferential vertical surface
D = diameter of the vane
H = height of the vane
τmV = maximum value of shear along the vertical surface.
When the engineer assumes a uniform shear strength distribution, isotropic shear strength, and a rectangular vane with L/H = 2, then the undrained shear strength computes from the following formula:
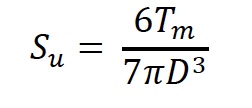
Where Su = the undrained shear strength
Tm = maximum value of measured torque
D = diameter of the vane
Lund, et. al. (1996) presents formulas for computing undrained shear strength for different sizes of vanes, whether the soil has isotropic or anisotropic properties, and stress distributions on Table 1 below:
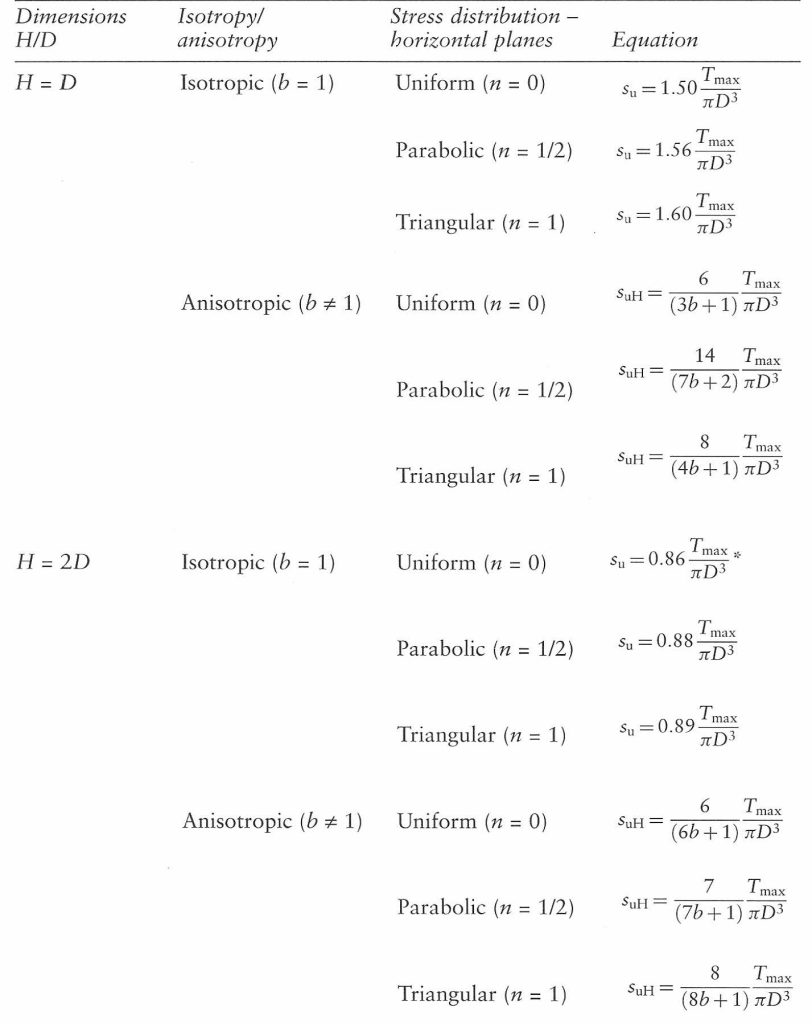
Table 1: Formulas for computing undrained shear strength (Lund, et. al. 1996)
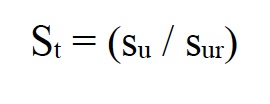
After rotating the vane rapidly for 5 to 10 full revolutions, the engineer turns the vane slowly and measures the residual shear strength, Sur, using the above equation. Dr. Tim Stark (2021) points out that engineers have often incorrectly expressed the residual shear strength as the remolded shear strength on their vane shear test reports. This value corresponds to laboratory tests and represents the lowest value of shear strength. The residual shear strength should be used for the shear strength of clays that have previously failed for slope stability analyses. The soil’s sensitivity, St, computes as the ratio of the undisturbed su to the residual strength, sur.
A high sensitivity indicates an unstable soil, which may collapse during loading and which will be especially sensitive to dynamic or impact loading. Soft marine clays are often sensitive. Mitchell (Fundamentals of Soil Behavior, 1976) provides the following guidelines for sensitivity (Table 2):
Table 2: Clay sensitivity guidelines
Bjerrum felt the discrepancies between vane strength and field strength were due to:
- shear strength depends on rate of loading (most important)
- shear strength is anisotropic
- in the field the shear strength is reduced by progressive failure
Figure 9 shows corrections proposed by Bjerrum (1972) and Azzouz, et. al.(1983):
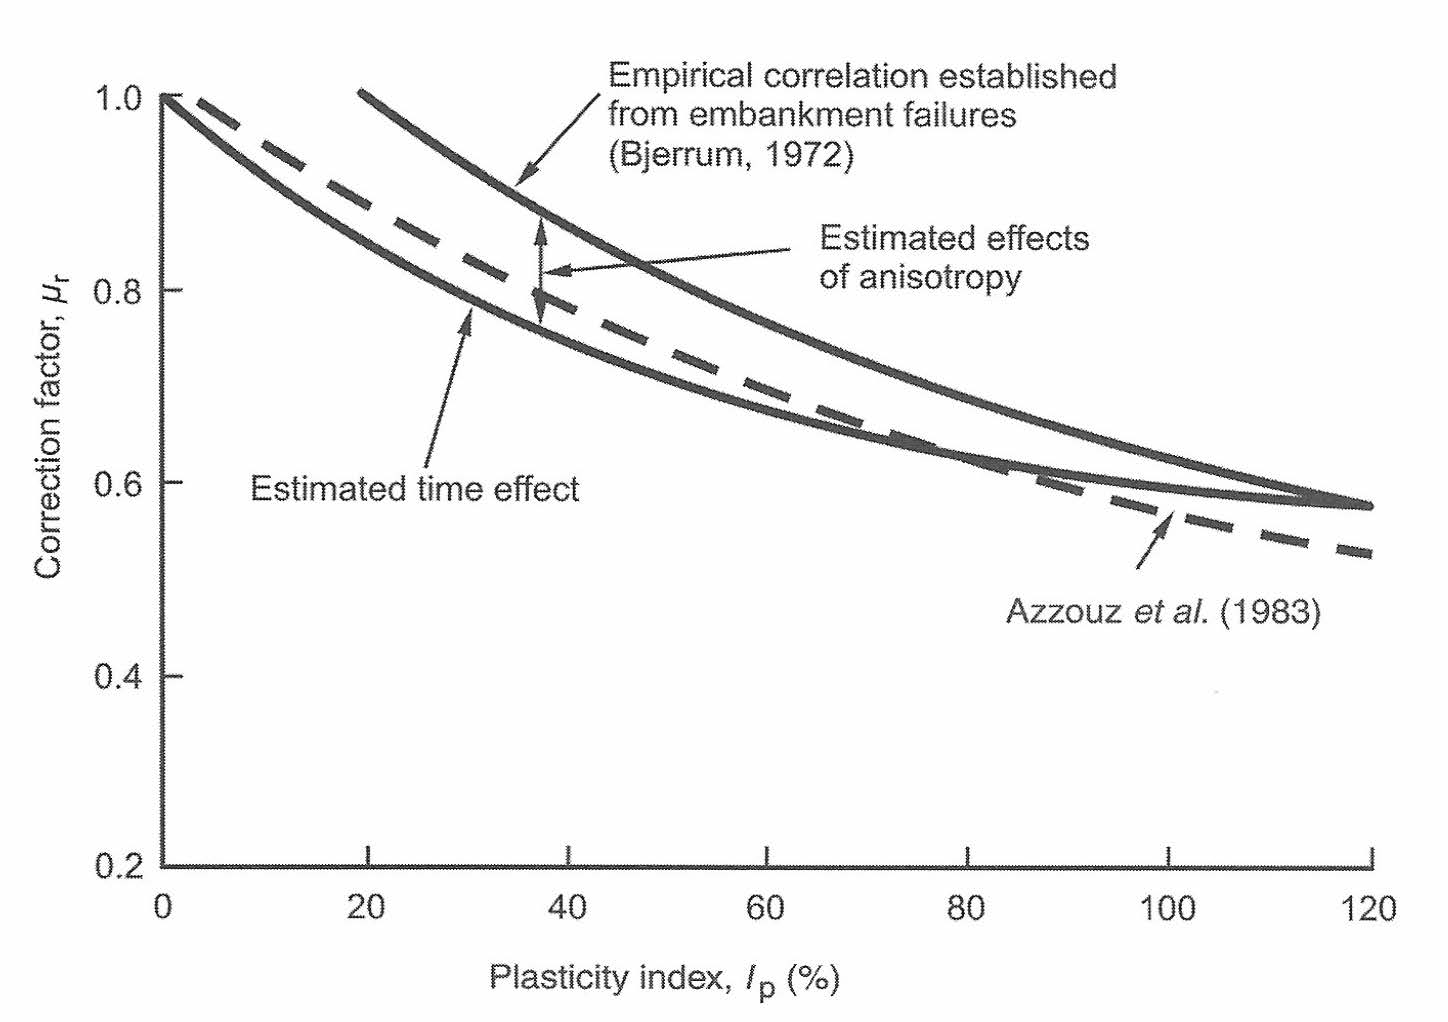
Figure 9: Bjerrum and Azzouz correction factors
Schmertmann made a simplified study of the VST in terms of effective stresses and came up with the following list of conditions for successful application of field vane strengths to undrained stability problems:
- saturated soil
- clay (for low permeability)
- minimum volume for vane itself
- all disturbance except vane eliminated
- soft, geologically recent, NC clay
- H/ D ratio of vane suitable to inclination of failure surface in field
- plane strain failure in field
- no extensive planes of weakness in field
- vane failure surface must be free of local obstructions
- no significant progressive action in field failure
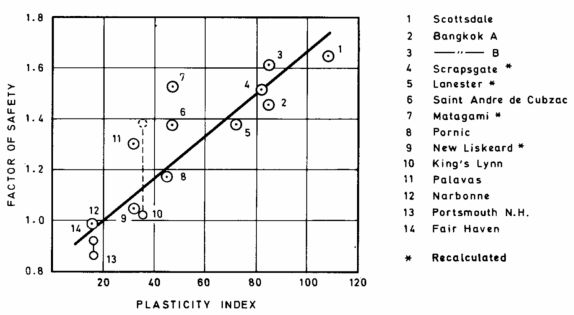
Aas, Lacasse, Lunne and Hoeg (Blacksburg, 1986) followed Bjerrum’s work with diagrams that include stress history: (Figure 10)
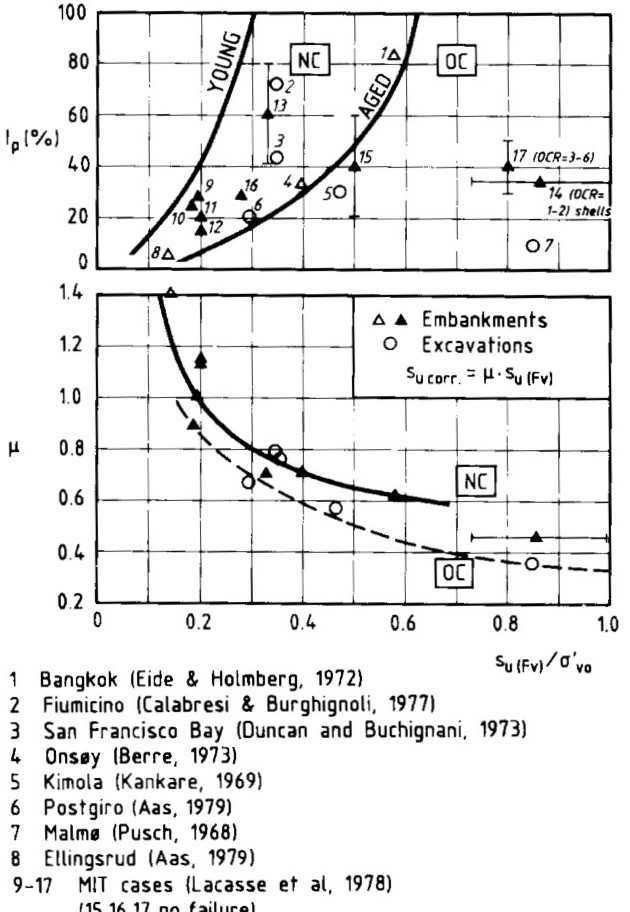
Figure 10: Corrections from stress history