Standard Penetration Test with Torque and Weak Rock Procedure
Benefits of the Standard Penetration Test:
- Can almost always advance the boring to the desired depth in overburden soils
- Obtain a soil sample for visual classification and laboratory tests
- Estimate the unit weight by collecting an exact volume of soil
- Torquing the sampler after driving provides a static strength parameter and predicts side resistance for deep foundations
- In weak or weathered rock, Stark et al. (2021) measures the penetration distance for every 10 blows (modified test procedure [MSPT]) to evaluate the unconfined compressive strength (UCS) between 10 and 100 ksf.
While the standard penetration test is the most common in-situ test performed in North and South America, the term “standard” misleads design engineers. Skilled drillers routinely achieve meaningful results with this rugged sampler. Terzaghi and Peck (1948) published early geotechnical design correlations, such as the spread footing design chart for sand shown as Figure 1, which popularized the SPT and encouraged its acceptance as a “standard”. McGregor and Duncan (1998) updated the design correlations and testing procedure for the SPT.
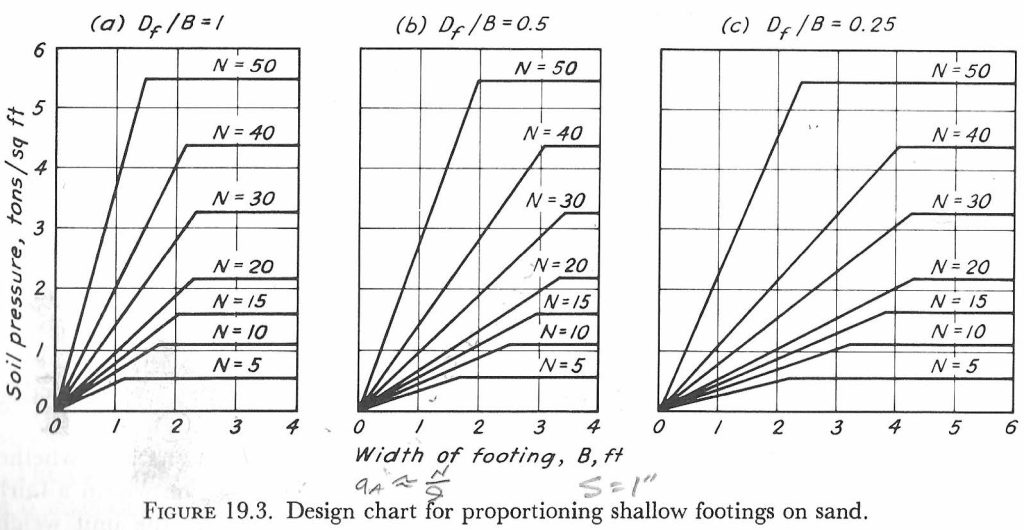
Figure 1: Peck design chart for spread footings on sand
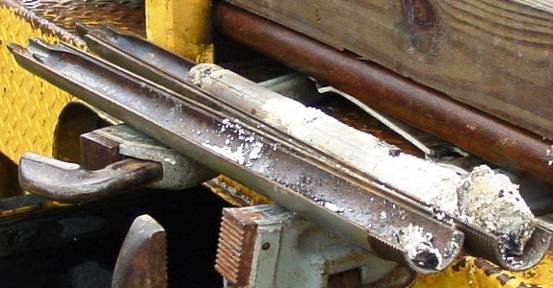
Figure 2: Split spoon SPT sampler
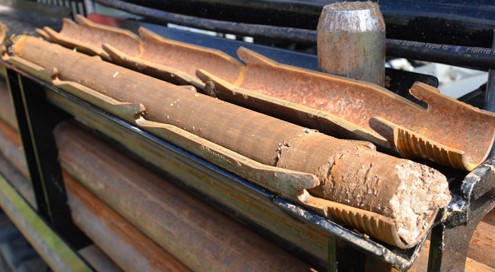
Figure 3: Finger Split Spoon Sampler [Left: opened with sample] [Right: assembled]
Hammer Energy: The three styles of SPT hammer in common use (see Figure 4) deliver energy to the drill rods that varies from about 45% to 95% of the theoretically available potential driving energy of 4200 in lbs (140 pounds x 30 inch drop). This variation, plus the use of non standardized drilling techniques, led Schmertmann (1978) to investigate their effect on the value of NSPT, which he found to exceed a factor of two. In addition, Schmertmann (1979) also found that NSPT varied approximately inversely in proportion to the hammer energy delivered to the drill rods. Schmertmann and Palacios (1979) made energy measurements comparing operator delivered energy with a hammer raised to 30 inch height and cutting the lifting rope, simulating free fall hammer drop. Now with the advent of modern computers, energy measurement devices (Figure 5) allow engineers to easily measure the actual driving energy entering the rods as described in ASTM D4633. The engineer can then correct the measured value of NSPT to N60, the equivalent blow count at 60% of the theoretical hammer energy (thought to represent the average energy in the correlation database). Skempton (1986) presented a method to compute N60 values from raw NSPT data, which is incorporated in ASTM D6066.
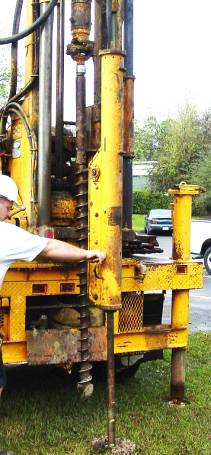
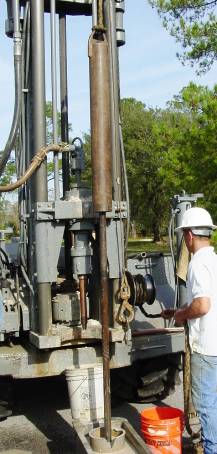
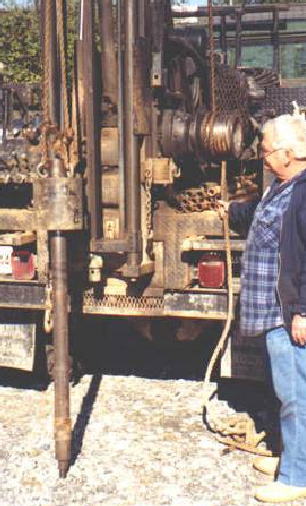
Figure 4:
a) Automatic Hammer ~95% efficiency,
b) Safety Hammer ~60% efficiency,
c) Donut Hammer ~45% efficiency.
(photo from GeoServices Corp.)
Figure 4: The three styles of SPT hammer in common use
Unfortunately, N60 values rarely appear on boring logs. The barrel on the old samplers had the same inner diameter as the shoe (1.375 inch 35 mm ID). Today, an alternative sampler barrel in common use has a larger inside diameter (1.5 inch 38 mm ID) to accommodate liners with an inner diameter the same as the shoe. However, liners are rarely used – Skempton suggests multiplying the N-value by 1.2 for this correction to account for the lack of frictional resistance along the inside of the split spoon sampler. Automatic trip hammers, now in widespread use, may deliver almost 95% of the theoretical energy if well-maintained. For example, for an efficiency of 95%,, the engineer multiplies Nfield by 1.58 to get N60. The engineer can convert the field values to N60 values using this Excel spreadsheet SPT N field value to N60 Look-up Table. Without making the N60 correction results in overly conservative and costly design.
The dynamic energy delivered from the SPT hammer to the split spoon sampler remolds sensitive clay and destroys the latent rock structure found in residual soil. Based on these low SPT N values, engineers’ predictions of deformation modulus from standard correlations give moduli that are about ¼ of their actual values (from our experience at various project sites). Even with the best techniques, how the soil responds to static structural loading based on the results of a dynamic test penetration tests leads to highly inaccurate settlement predictions for embankments or shallow spread footings.
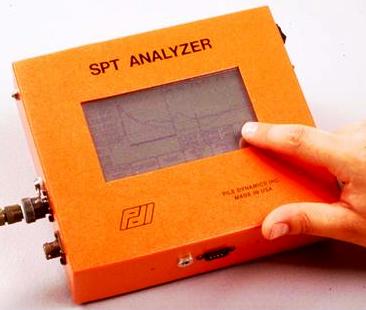
Figure 5: SPT Energy Measurement
SPT models the driving of a pile. Schmertmann and Crapps (1983) show that the SPT based on N60 values better predicted the vertical capacity of piles than other design methods using different tests.
Updating the SPT to the 21st Century: Lutenegger (2021) recommends procedures that should be adopted by every geotechnical engineer when performing SPT.
SPT Density Sampler: Why do we put a random amount of soil into a glass jar? What if we put an exact volume of soil into the jar? We could weigh the jar, then subtract the weight of an empty jar and lid and calculate the weight of the soil. By dividing the soil weight by its volume, the engineer can calculate the unit weight of the soil.
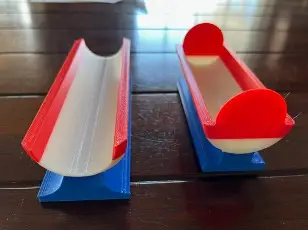
Dr. Jeramy Ashlock (Handy Geotechnical Instruments and Professor at Iowa State University) and Roger Failmezger created a SPT density sampler tool that acts like a “cookie cutter” and gets a 4.50 inch long sample (109.5 cm3) from the split spoon. The soil from the sampler empties into the half-circular transfer tool and slides into the jar from the transfer tool. A 3-D printer makes these tools using Bambu files, available for free to you (Figure 6). Multiply grams/cm3 by 62.4 to get pounds/foot3.
While the SPT spoon sample has disturbance, what effect does disturbance have on the soil’s unit weight? Superior measurements of unit weight from either undisturbed soil samples or Nuclear density gauge tests compared with the unit weight from SPT density samples will determine what corrections are needed to improve accuracy of these tests. When you make these comparison measurements, please submit your data to the Geosetta database (SPT Density Correlation) and enjoy the satisfaction of knowing that you have improved the corrections.
Figure 6: SPT Density Sampler (right) Soil Transfer Tool (left)
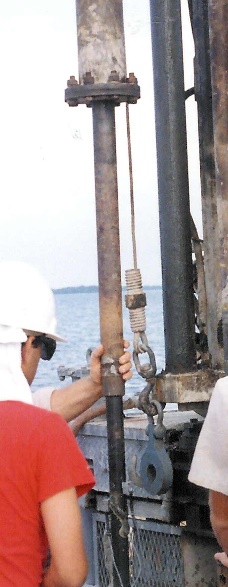
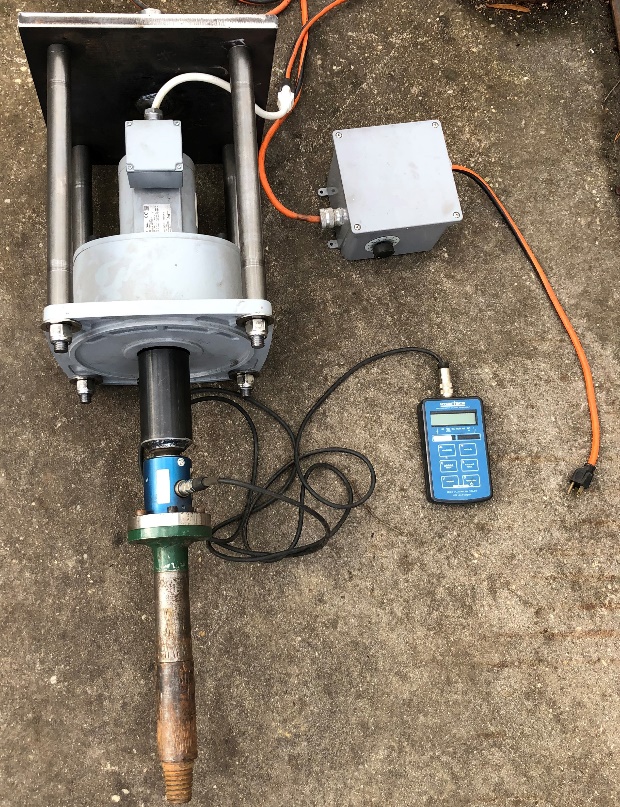
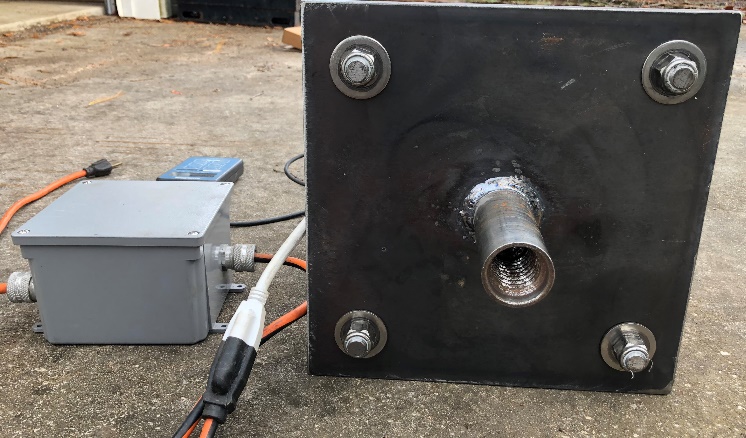
Torque Measurement: After driving the split spoon sampler, the driller removes the hammer and anvil and screws on the torque cell and sets the high-torque, slow-rotating, electric motor on the torque cell. A pipe wrench braced against the drill rig provides the reaction force. The electric motor rotates the split spoon sampler at a constant rotation rate of 0.2 degrees per second, meeting ASTM D-2573 rotation rate specifications for a vane shear test and removing the parasitic testing error from manually rotation (Figure 7). Essentially, the split spoon sampler acts like a crude but robust vane. A tablet records the torque and rotation angle measurements, displaying their results on its screen. The test only takes about 3 minutes to perform to get the peak torque.
With the torque measurement, the geotechnical engineer gains a static strength measurement from the otherwise dynamic soil test. DeCourt (1998), Lutenegger and Kelley (1998), and Kelley and Lutenegger (1999) show better predictions of side resistance for driven piles and generally better predictions of soil properties with the torque measurement.
Figure 7: Electric motor SPT torque equipment (left) Top adapter for hoist cable and during test for pipe wrench to provide reaction for torque motor (right)
Shown on the adjacent video the engineer accurately measures the peak torque value three minutes after the spoon was driven. If the split spoon remains in the soil overnight and then torqued the following morning, then the engineer can get a measure of pile set-up. Winter, Wagner, and Komurka (2005) show that torquing the soil 60 minutes after driving did not show significate gain, but the next day measurement gained about 60% in Wisconsin clay.
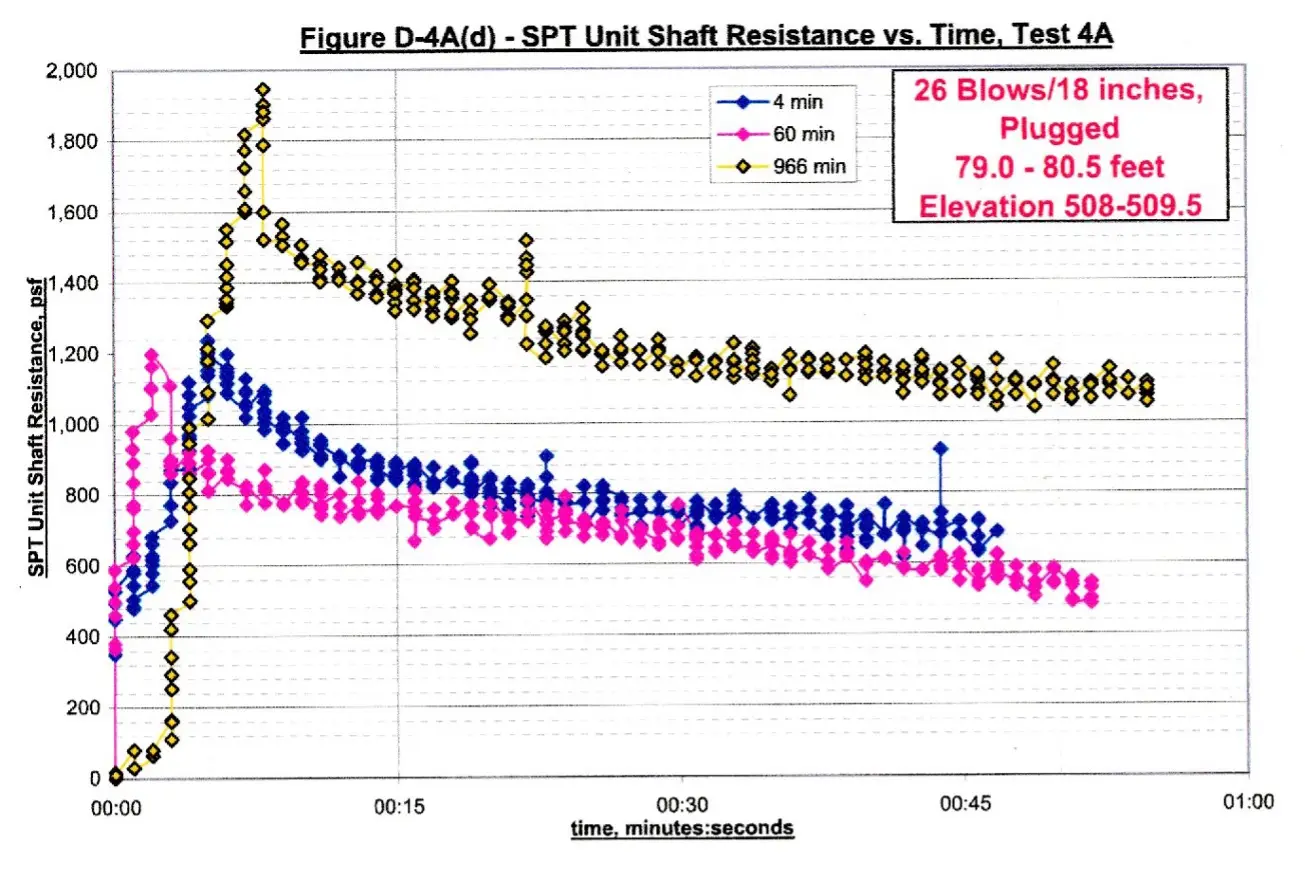
Figure 8: Significant torque gain from next day testing
Additional research comparing load tests and SPT-Torque measurements will improve designs in the future.
Drive set measurement: With a string potentiometer and a shock sensor, a tablet can measure the vertical movement or set of the SPT split spoon sampler after each hammer blow.
Stark, et. al. (2017) modified the standard penetration test procedure (MSPT) using calibrated energy (MSPT) to assess the in situ unconfined compressive strength (UCS) and Young’s modulus of weak fine-grained rock for design. He termed this new procedure the Modified SPT (MSPT) and manually measured the penetration for every 10 hammer blows to 100 blows (10 measurements) or when penetration ceases to predict UCS. With the MSPT, the inspecting geologist or engineer makes the additional penetration measurement after every ten hammer blows, while the driller makes the standard SPT blow count measurement.
Figure 9 shows the penetration depth versus blow count relationship, characterized by an initial slope and a secondary slope. The initial slope is associated with disturbed and loose material at the bottom of the borehole and the tip of the split-spoon sampler easilypenetrating this material. The initial slope is displacement or depth dependent and shows displacement hardening behavior. The initial slope does not represent the UCS of the undisturbed or intact weak rock and thus is not used for the Ṅ90 (NRate)90 correlation developed herein.
Figure 9: Typical MSPT penetration depth versus blow counts plot for Illinois weak shale
The secondary or linear slope represents the undisturbed or intact weak rock, which usually occurs after 30 blows, and is approximately constant with increasing displacement. Stark defines the slope of that line as the Ṅ90 (NRate)90 for a hammer with an energy efficiency of 90%. For a hammer with an efficiency different than 90%, the engineer multiplies the calculated slope by the hammer’s calibrated efficiency/90%. The engineer uses this computed slope to develop a site or project specific correlation with the unconfined compressive strength (UCS) of the undisturbed weak rock and/or verifies the correlation developed by Stark et. al. applies. Based on a subsurface investigation at twenty-one (21) weak fine-grained shale/siltstone sites throughout Illinois, Stark, et. al. (2021) developed the following correlations between Ṅ90 and UCS to obtain side resistance (Figure 10) and end bearing (Figure 11) of deep foundation systems.
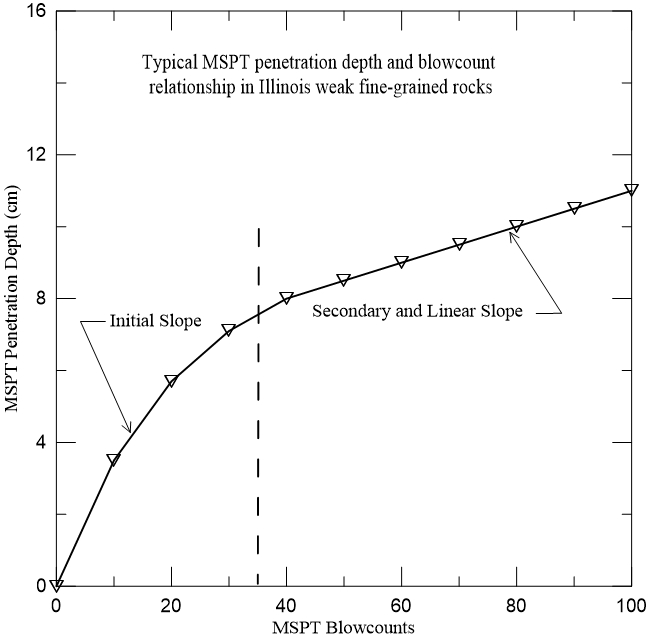
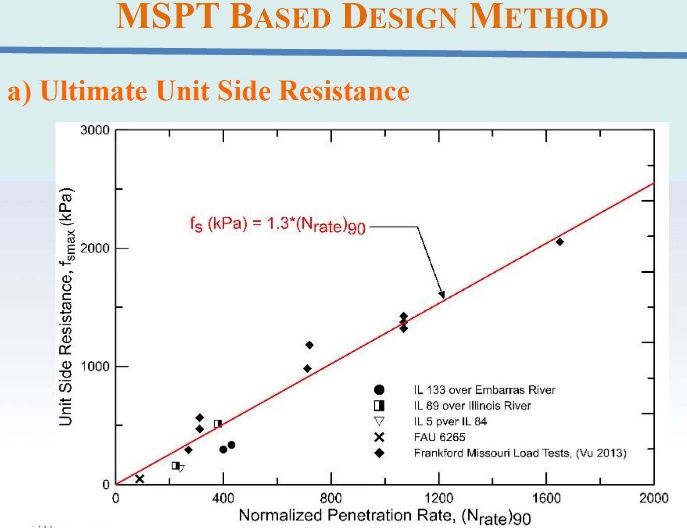
Figure 10: Frictional Resistance versus N90 rate
(Weak Shale)
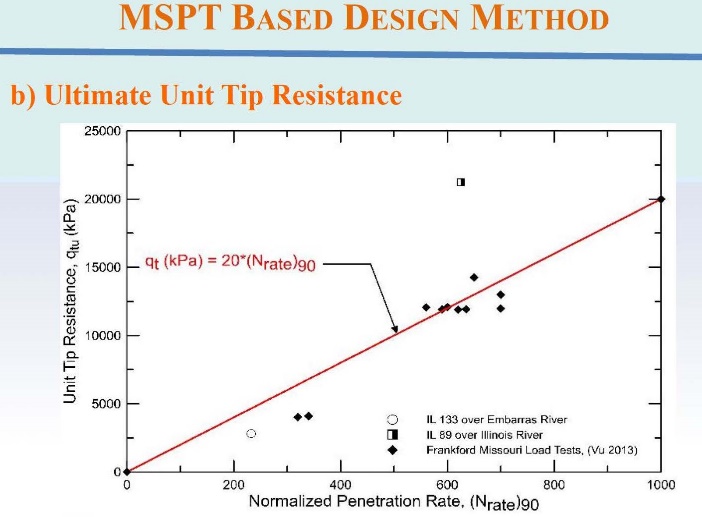
Figure 11: Tip Capacity versus N90 rate
(Weak Shale)
Figure 12 shows the average trend line can be expressed as UCS (qu) equals:
qu (kPa) = 4.4 (NRate)90
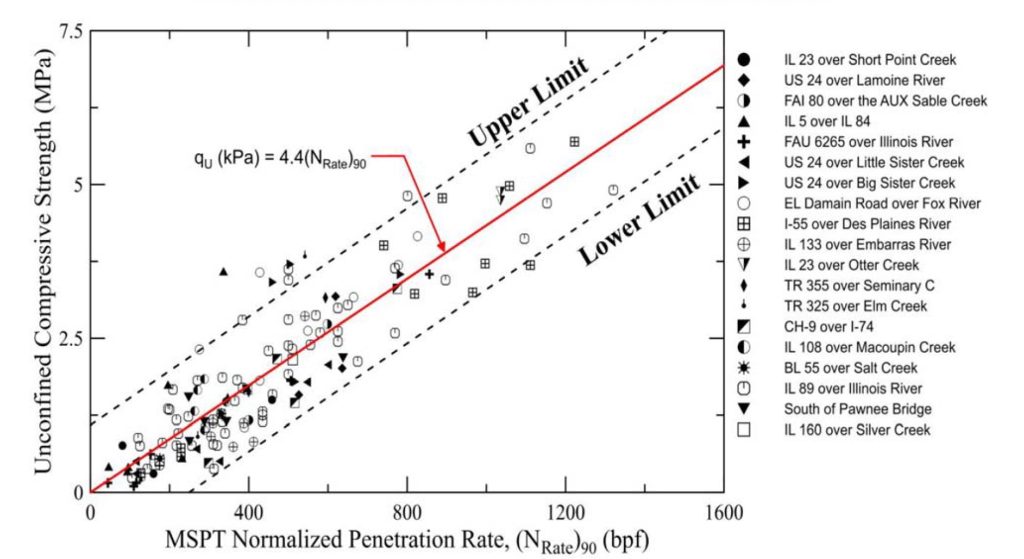
Figure 10: Relationship between UCS and Ṅ90 (NRate)90 for weak shale in Illinois
Stark suggests using the following MSPT procedure and compute the Ṅ90 (N90 rate) [MSPT Video]:
- Drill to the desired depth of the MSPT,
- The split-spoon sampler and the driving shoe should be in good to new condition and must be replaced when it becomes dented or distorted.
- Choose and mark a convenient point on the exposed drill rod at which penetration measurements will be made; such as the bottom of the anvil or a drill rod joint or third mark for SPT.
- Measure the initial length of the drill rod segment between the top of the borehole casing and the point chosen in Step 3.
- Apply ten (10) blows to the top of the drill rod using the 63.5 kg (140 lbf) hammer falling 0.76 m (30 inches) and measure the new length of the drill rod segment between the top of the borehole casing and mark/point chosen in Step 3. This can be accomplished by stopping the test or using a stick rule that is placed along this length and reading the remaining length before the 11th blow is applied by the automatic hammer.
- Repeat Steps 3 through 5 to obtain the sampler penetration for the 20-, 30-, 40-, 50-, 60-, 70-, 80-, 90-, and 100-blow count increments.
- Input the penetration depth versus the cumulative blow counts using Stark’s Excel spreadsheet to compute Ṅ90 (NRate)90 and UCS of the weak rock.
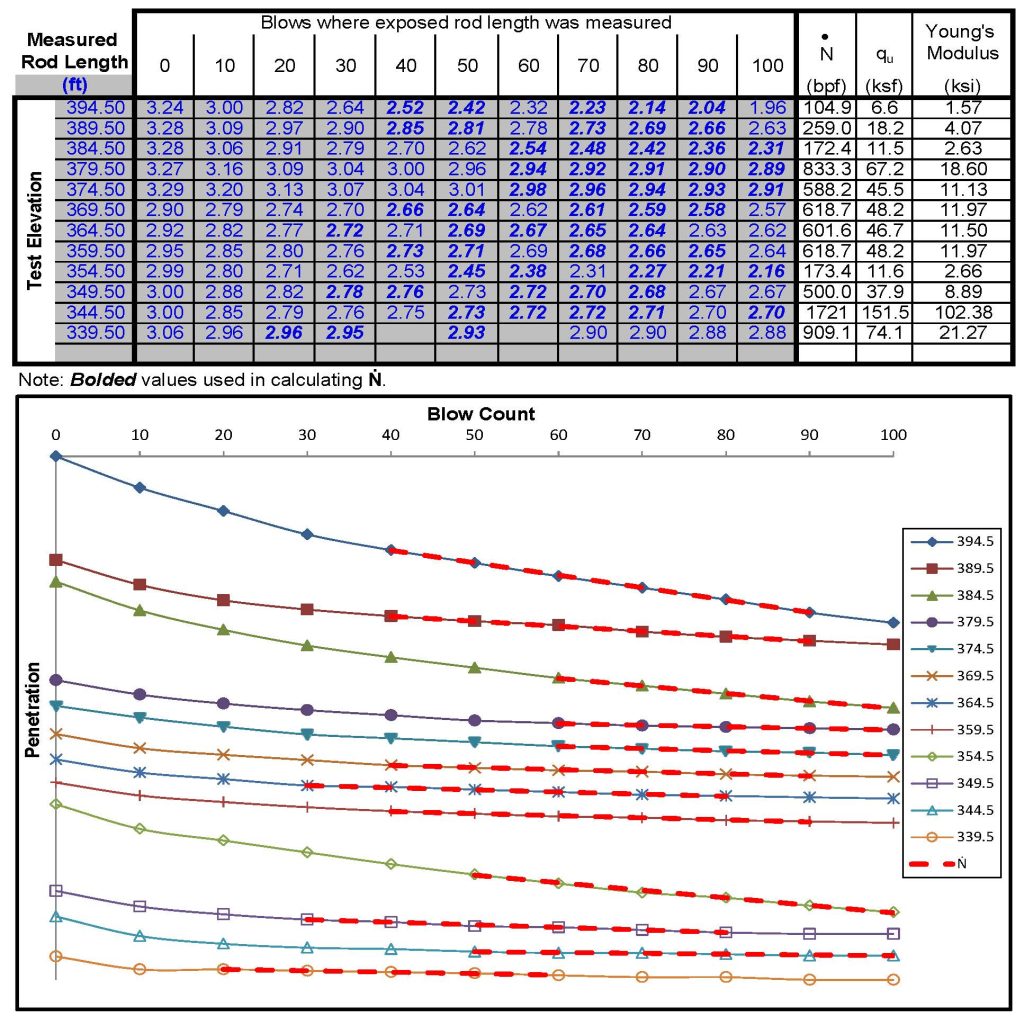
Figure 12: Typical modified SPT results