Rock Pressuremeter Test

Benefits of the Rock Pressuremeter Test:

  • Saves money for the project by accurately measuring the strength and deformation properties of rock
  • Can be used for lateral load and deformation analyses of drilled shafts

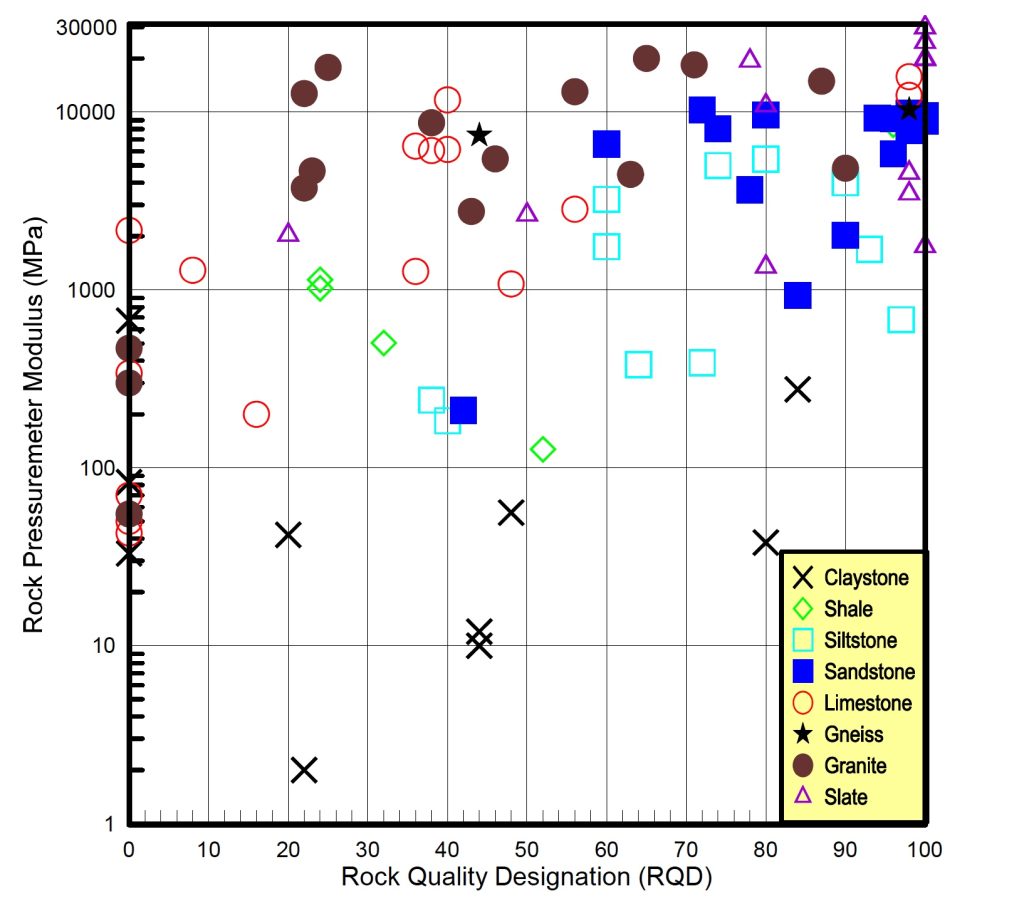
Rock Pressuremeter Test:  Often geotechnical engineers grossly underestimate the rock’s capacity (by a factor of 10 or more) because of the difficulty of measuring it.  The rock modulus cannot be estimated or correlated from rock quality designation (RQD) as believed by many engineers (Figure 1 shows the “shotgun” correlation blast).  However, the geotechnical engineer can use rock pressuremeter test data for lateral load and deformation analyses of drilled shafts.  (Failmezger, et al., 2005

“Shotgun” correlation between RQD and Rock pressuremeter modulus

Figure 1: “Shotgun” correlation between RQD and Rock pressuremeter modulus

The conventional soil pressuremeter, which uses either water or compressed gas to inflate it, can only apply 100 bars of pressure, which is inadequate for testing rock.  A rock pressuremeter that uses a hydraulic piston applies up to 300 bars (30 MPa) of pressure stressing the rock (Figures 2 and 3).  The hydraulic pump extends a piston inside the rock pressuremeter probe downward, pressurizing the fluid inside the membrane and causing it to expand into the rock.  An electronic pressure transducer measures the applied pressure.  A linear variable displacement transducer (LVDT) located on top of the hydraulic piston measures the volume of the probe as it inflates into the rock.  The volume equals the distance that the piston moves multiplied by the piston area.

Rock pressuremeter probe
Rock pressuremeter calibration

Figures 2 and 3: Rock pressuremeter probe/calibration tube and hydraulic piston/data logger

The driller cores the rock with an NX-size core barrel.  The engineer and geologist examine the rock core and determine the best locations to perform the tests.  The field crew threads the rock pressuremeter hydraulic and electrical (LVTD) sensor cables through the wireline casing, which protects them.  The driller lowers the rock pressuremeter probe that attaches to the wireline casing (conveniently used like rods to lower and remove the pressuremeter) to the bottom-most test depth (Figure 4) and the engineer performs either a stress-controlled or strain-controlled rock pressuremeter test.  For stress-controlled tests, the engineer uses 1 MPa stress increments for fair-quality rock and 3 MPa stress increments for high-quality rock.  For strain-controlled tests, the engineer uses either 30 cm3 volume increments for fair-quality rock or 10 cm3 volume increments for high-quality rock.  Depending on the diameter of the diamond rock core shoe, the rock pressuremeter contacts the rock borehole sidewall at a volume between 130 and 180 cm3.  After the engineer applies pressure to the rock, the field data logger records the pressure and volume after an elapsed time of usually 1 minute.  When the test is completed, the engineer deflates the membrane and the driller raises the rock pressuremeter to the next test depth.

Rock pressuremeter probe lowered into borehole

Figure 4: Rock pressuremeter probe lowered into borehole

Marcil, et. al. (2013) show experience and use of the Probex rock pressuremeter developed by Roctest over 25 years.  Baud, et. al. (2021) have developed a rock pressuremeter that applies up to 50 MPa of pressure to the rock.  Baud (2021) presents additional correlations of rock.  They present their recent correlations from this powerful device and plan to improve them as they make more measurements. Figure 5 shows Baud’s durability correlation chart from rock pressuremeter tests.  Figure 6 shows Baud’s correlations for rheological factor and angle of internal friction.  Figure 7 shows Baud’s rock/soil classification chart.

Rock Durability Correlation Chart

Figure 5: Rock Durability Correlation Chart

Correlations for Rheologic Factor and Angle of Internal Friction

Figure 6: Correlations for Rheologic Factor and Angle of Internal Friction

Rock/Soil Classification Chart

Figure 7: Rock/Soil Classification Chart